Formation Markets External research programme

Seeing Like
a Market

The Formation Markets team has been at the forefront of market formation and institutional risk transfer using event contracts and perpetual futures.

Our work includes the first papers dedicated to institutional risk transfer through modern prediction markets, the first company KPI app and the first live SMB hedging app.

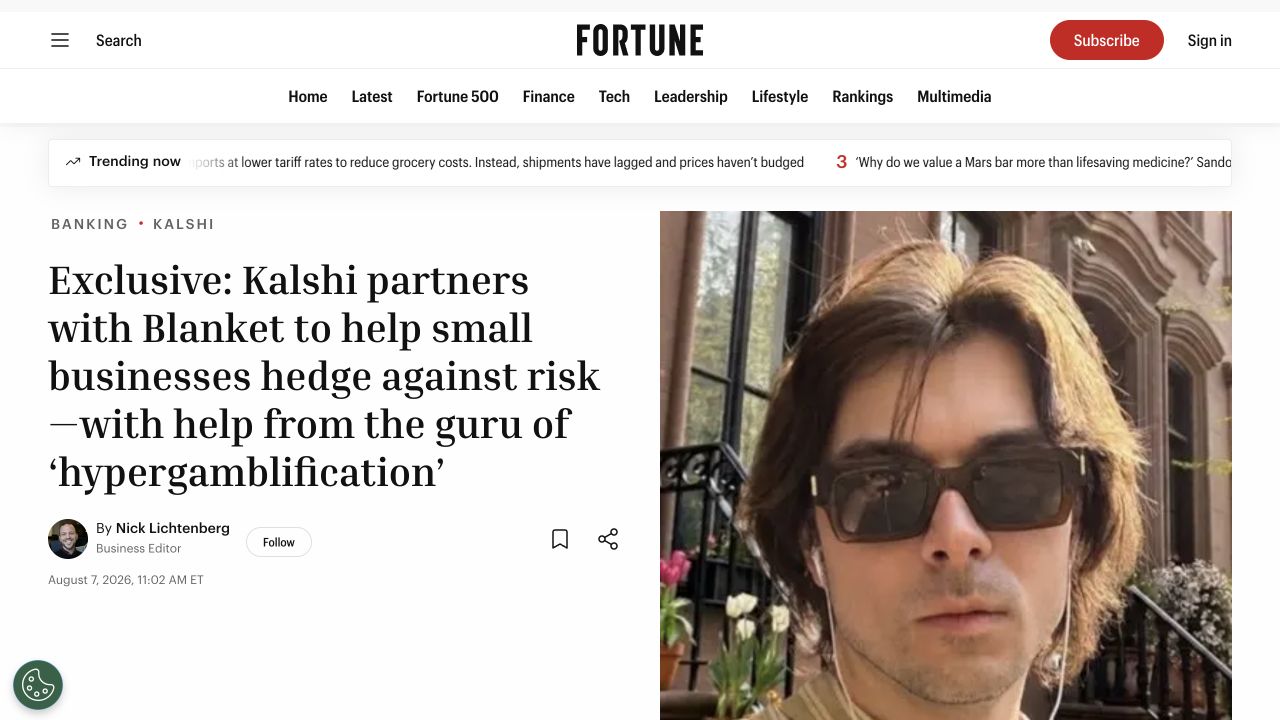
Featured in Fortune.
Interactive research

The Formation Markets team builds tools for market structure, business hedging and company KPI derivatives. Explore Statebook, Blanket and Hedgebook.

Direct or signed boundary claims supply the same terminal payoff. Synthetic illustration. Terminal payoffDirect claim+ Boundary A− Boundary BConstructed payoff = + A − B
Terminal-payoff architecture · Synthetic illustration

Payoff architecture

Statebook

Markets organised by terminal payoff.

Statebook makes the Formation Markets team’s payoff architecture explorable. Compare direct claims with constructed routes, inspect the residual exposure and see how separate contract books connect through the payments they deliver.

Business loss and contract payment share common axes; gold shows residual exposure. Business exposureContract paymentResidual exposureEconomic outcome →
Exposure, payment and residual · Conceptual illustration

Business risk transfer

Blanket

The first live SMB hedging app built around prediction markets.

We built Blanket so businesses can describe a risk, find relevant live Kalshi contracts and model the remaining exposure. Its market-gap view shows where demand calls for new contracts.

A published company metric moves into the KPI definition and connects to the claim. CompanydisclosureCompanyKPIDefinitionPublished metricKPI claimPayoff
Company performance → public reference → financial claim · Conceptual illustration

Company performance

Hedgebook

The first interactive app for company KPI derivatives.

We built Hedgebook to connect company operating performance with live event contracts. Explore company dossiers, KPI definitions, contractual payoffs and traditional-market analogues—and inspect how each claim fits the underlying business exposure.

Working papers

Four papers from the Formation Markets team on market structure, matched exposure, public pricing and legal claim formation.

Signed boundary claims assemble into the interval payoff. + Boundary A− Boundary BTerminal payoff
Research plate · Conceptual illustration

Working paper · September 2026

Markets for All States of the World: Market Structure Organized by Terminal Payoff

We propose market structure organised by terminal payoff, allowing interval claims to trade without their own order books. The paper connects payoff construction to execution, funding, regulatory access and offsets that survive close-out.

Two public trading routes meet the same terminal exposure; the price wedge is fixed between them. Event contractDerivative routeTerminalexposureMatched-State Wedge
Research plate · Conceptual illustration

Working draft

Event Contracts and the Cost of Matched State Exposure

Event contracts and conventional derivatives can deliver closely matched terminal exposure through different routes. We define the Matched-State Wedge and compare execution, funding, operating and settlement costs using a fixed June 2026 comparison.

The highlighted matrix cell is the Observability Wedge: own public quote; no qualifying independent route. Observability WedgeOwn public quote;no qualifyingindependent route
Research plate · Conceptual illustration

Working draft

The Observability Wedge: Public Addressability and Relational Integration of State Prices

A claim can have a public quote before another instrument independently prices its payoff. The Observability Wedge separates public addressability, independent pricing routes and participants willing to trade.

Reconstruction, replacement and close-out valuation are separate mandates. Contractual referenceReconstructionReplacementClose-outvaluation
Research plate · Conceptual illustration

Published working paper · 30 October 2026

From Exposure to Claim: The Formation of Frontier Financial Markets and ISDA

Institutions may have capital and a reason to trade yet lack a claim they can use. Through compute rental protection, company sales and GPU financing, we examine how parties negotiate usable claims under ISDA, and how software agents could reduce the work of developing and reusing them.

The original SLAM Explorer: 87 event contracts projected by execution cost, wedge and asset class. BTC ≥ $100K — Dec 2024 · Execution cost 51.0464% · Wedge 15.7163%BTC ≥ $100K — Jan 2026 · Execution cost 0.9333% · Wedge 4.0804%BTC ≥ $100K — Nov 2024 · Execution cost 0.9556% · Wedge -4.5438%BTC ≥ $105K — Jan 2026 · Execution cost 0.8565% · Wedge 4.0804%BTC ≥ $110K — Dec 2024 · Execution cost 1.1837% · Wedge 15.7163%BTC ≥ $110K — Jan 2026 · Execution cost 0.8517% · Wedge 4.0804%BTC ≥ $115K — Nov 2025 · Execution cost 0.9926% · Wedge 4.2946%BTC ≥ $120K — Nov 2025 · Execution cost 10.602% · Wedge 4.2946%BTC ≥ $125K — Jan 2026 · Execution cost 13.8259% · Wedge 4.0804%BTC ≥ $130K — 2025 · Execution cost 0.7041% · Wedge 8.8148%BTC ≥ $130K — Nov 2025 · Execution cost 15.1204% · Wedge 4.2946%BTC ≥ $130K — Oct 2025 · Execution cost 1.0515% · Wedge 1.063%BTC ≥ $150K — 2025 · Execution cost 0.4109% · Wedge 8.8148%BTC ≥ $150K — Jan 2026 · Execution cost 0.1257% · Wedge 4.0804%BTC ≥ $150K — Nov 2025 · Execution cost 14.5773% · Wedge 4.2946%BTC ≥ $150K — Oct 2025 · Execution cost 0.7034% · Wedge 1.063%BTC ≥ $200K — 2025 · Execution cost 0.2477% · Wedge 8.8148%BTC ≥ $200K — Nov 2025 · Execution cost 0.2064% · Wedge 4.2946%BTC ≥ $200K — Oct 2025 · Execution cost 0.2243% · Wedge 1.063%BTC ≥ $250K — 2025 · Execution cost 0.2361% · Wedge 8.8148%Argentina Deputies Election — 2025 · Execution cost 0.3288% · Wedge 24.0595%Australia Parliament — 2025 · Execution cost 17.5744% · Wedge 23.3427%Canada Government Formation — 2025 · Execution cost 3.3271% · Wedge 12.2517%Canada Prime Minister — 2025 · Execution cost 0.4943% · Wedge 29.6449%Chile Presidential Election — 2025 · Execution cost 0.2344% · Wedge 20.5913%Germany Chancellor — 2025 · Execution cost 0.3446% · Wedge 10.5337%Germany Parliament — 2025 · Execution cost 0.4473% · Wedge 14.7367%Ireland Presidential Election — 2025 · Execution cost 0.0381% · Wedge 10.0862%Ireland Prime Minister — 2024 · Execution cost 11.5292% · Wedge 2.142%Mexico Presidential Election — 2024 · Execution cost 40.2805% · Wedge 7.2909%Norway Parliament — 2025 · Execution cost 15.0722% · Wedge 22.8167%Poland Presidential Election — 2025 · Execution cost 0.8754% · Wedge 72.6464%Portugal Presidential Election — 2026 · Execution cost 0.1723% · Wedge -8.7951%Portugal Prime Minister — 2025 · Execution cost 14.8849% · Wedge 17.4042%South Korea Presidential Election — 2025 · Execution cost 0.2376% · Wedge 7.7334%Taiwan Presidential Election — 2024 · Execution cost 20.664% · Wedge 13.1014%United Kingdom Prime Minister — 2024 · Execution cost 50.286% · Wedge 11.4285%Nasdaq 100 ≤ 13250 — Dec 2024 · Execution cost 28.0849% · Wedge 1.8133%Nasdaq 100 ≤ 13750 — Dec 2024 · Execution cost 20.0821% · Wedge 1.8133%Nasdaq 100 ≤ 14250 — Dec 2024 · Execution cost 28.5271% · Wedge 1.8133%Nasdaq 100 ≥ 12250 — Dec 2024 · Execution cost 0.982% · Wedge 1.8133%Nasdaq 100 ≥ 12750 — Dec 2024 · Execution cost 15.9195% · Wedge 1.8133%S&P 500 ≤ 3300 — Dec 2024 · Execution cost 2.9401% · Wedge 2.1319%S&P 500 ≤ 3500 — Dec 2024 · Execution cost 15.0538% · Wedge 2.1319%S&P 500 ≤ 3700 — Dec 2024 · Execution cost 16.097% · Wedge 2.1319%S&P 500 ≤ 3900 — Dec 2024 · Execution cost 29.918% · Wedge 2.1319%S&P 500 ≤ 4500 — Dec 2024 · Execution cost 30.0184% · Wedge 2.1319%S&P 500 ≤ 4700 — Dec 2024 · Execution cost 28.6222% · Wedge 2.1319%S&P 500 ≥ 5700 — Dec 2024 · Execution cost 2.2936% · Wedge 2.1319%S&P 500 ≥ 5800 — Dec 2024 · Execution cost 23.0776% · Wedge 2.1319%FOMC 25bps Cut — Dec 2025 · Execution cost 0.5878% · Wedge 0.487%FOMC 25bps Cut — Jan 2026 · Execution cost 0.2313% · Wedge 0.5104%FOMC 25bps Hike — Dec 2025 · Execution cost 0.0973% · Wedge 0.487%FOMC 25bps Hike — Jan 2025 · Execution cost 0.0834% · Wedge 0.6126%FOMC 25bps Hike — Jan 2026 · Execution cost 0.0441% · Wedge 0.5104%FOMC 25bps Hike — Nov 2024 · Execution cost 0.0909% · Wedge 0.5154%FOMC 25bps Hike — Oct 2025 · Execution cost 0.07% · Wedge 0.6208%FOMC 25bps Hike — Sep 2025 · Execution cost 0.0537% · Wedge 0.7667%FOMC 50bps Cut — Dec 2025 · Execution cost 0.0846% · Wedge 0.487%FOMC 50bps Cut — Jan 2026 · Execution cost 0.0651% · Wedge 0.5104%FOMC Hold — Jan 2026 · Execution cost 0.1859% · Wedge 0.5104%FOMC Hold — Sep 2025 · Execution cost 0.4072% · Wedge 0.7667%Gold ≥ $3200 — EOY 2024 · Execution cost 0.9673% · Wedge 7.2895%Gold ≥ $3200 — EOY 2025 · Execution cost 21.5736% · Wedge 14.411%Gold ≥ $5500 — Jan 2026 · Execution cost 31.933% · Wedge 19.6362%Silver ≥ $110 — Jan 2026 · Execution cost 11.8513% · Wedge -10.1235%Silver ≥ $120 — Jan 2026 · Execution cost 12.5961% · Wedge -10.1235%Silver ≥ $150 — Jan 2026 · Execution cost 11.8546% · Wedge -10.1235%BOJ 25bps Hike — Dec 2025 · Execution cost 16.6397% · Wedge 2.2974%BOJ 50bps Hike — Dec 2025 · Execution cost 16.6667% · Wedge 2.2974%BOJ 50bps Hike — Jan 2026 · Execution cost 19.9773% · Wedge 5.1045%BOJ Cut — Jan 2026 · Execution cost 18.646% · Wedge 5.1045%BOJ Hold — Dec 2025 · Execution cost 19.4769% · Wedge 2.2974%CPI YoY — Apr 2025 · Execution cost 14.0091% · Wedge 0.7027%CPI YoY — May 2025 · Execution cost 50.5636% · Wedge 1.3497%CPI — Jul 2025 · Execution cost 50.2595% · Wedge 2.1988%CPI ≥ 3% YoY — Jun 2025 · Execution cost 50.9021% · Wedge 1.1222%ECB Meeting — Dec 2025 · Execution cost 36.9043% · Wedge 1.6329%ECB Meeting — Oct 2025 · Execution cost 27.221% · Wedge 2.8104%ECB Meeting — Sep 2025 · Execution cost 29.8255% · Wedge 2.0847%GDP Q1 — 2025 · Execution cost 50.4248% · Wedge -2.4082%GDP Q2 — 2025 · Execution cost 50.4137% · Wedge 3.852%GDP Q3 — 2025 · Execution cost 50.5826% · Wedge 2.2205%Gas Price — Apr 2025 · Execution cost 24.1476% · Wedge 13.2093%Gas Price — Jul 2025 · Execution cost 16.8752% · Wedge 31.2253%Gas Price — Jun 2025 · Execution cost 14.8428% · Wedge 3.7789%Gas Price — May 2025 · Execution cost 15.827% · Wedge 9.7737%

The original Seeing Like a Market · March 2026

Event Contracts
and Market Topology

The Formation Markets team’s original SLAM paper established the programme’s institutional risk-transfer thesis. Presented at the inaugural Kalshi Research Conference in March 2026, it connected prediction markets to the wider architecture of derivatives markets.

The original Explorer’s 87 event contracts.
Execution cost · Wedge · Asset class

Discuss the research
with Formation Markets.

lauris@formation.markets